Technote: Steel Coke Plant: Using Regression Analysis

Technote: Steel Coke Plant: Using Regression Analysis:

Slightly off-topic this may be of interest to those working in the Steel Industry, particularly Coke Oven Plant machinery. I worked in this industry for a few years before being made redundant when the company closed operations.

I briefly touched on the Application of surface modelling for tanks and hoppers to ensure volume and mass calculations are correctly interpreted in the CAD model. A link to that article is here. https://hughtechnotes.wordpress.com/2016/12/08/hoppers-surface-model-for-mass-containment/

This company for some reason were unaware of this technique which is one of the reasons why I wrote that blog article as others may also find it useful. An exert from the article:

“This type of hopper is fed from an overhead bunker and releases the fill material through an aperture in the base. The mass volume is modelled according to industry specifications that define the slope of the poured coal defined by the size of the top bunker opening.

The surface represents the containment boundary which has zero volume and zero mass therefore by definition will ensure that the only properties recorded for mass and volume in the 3d model relate only to the fill material.”

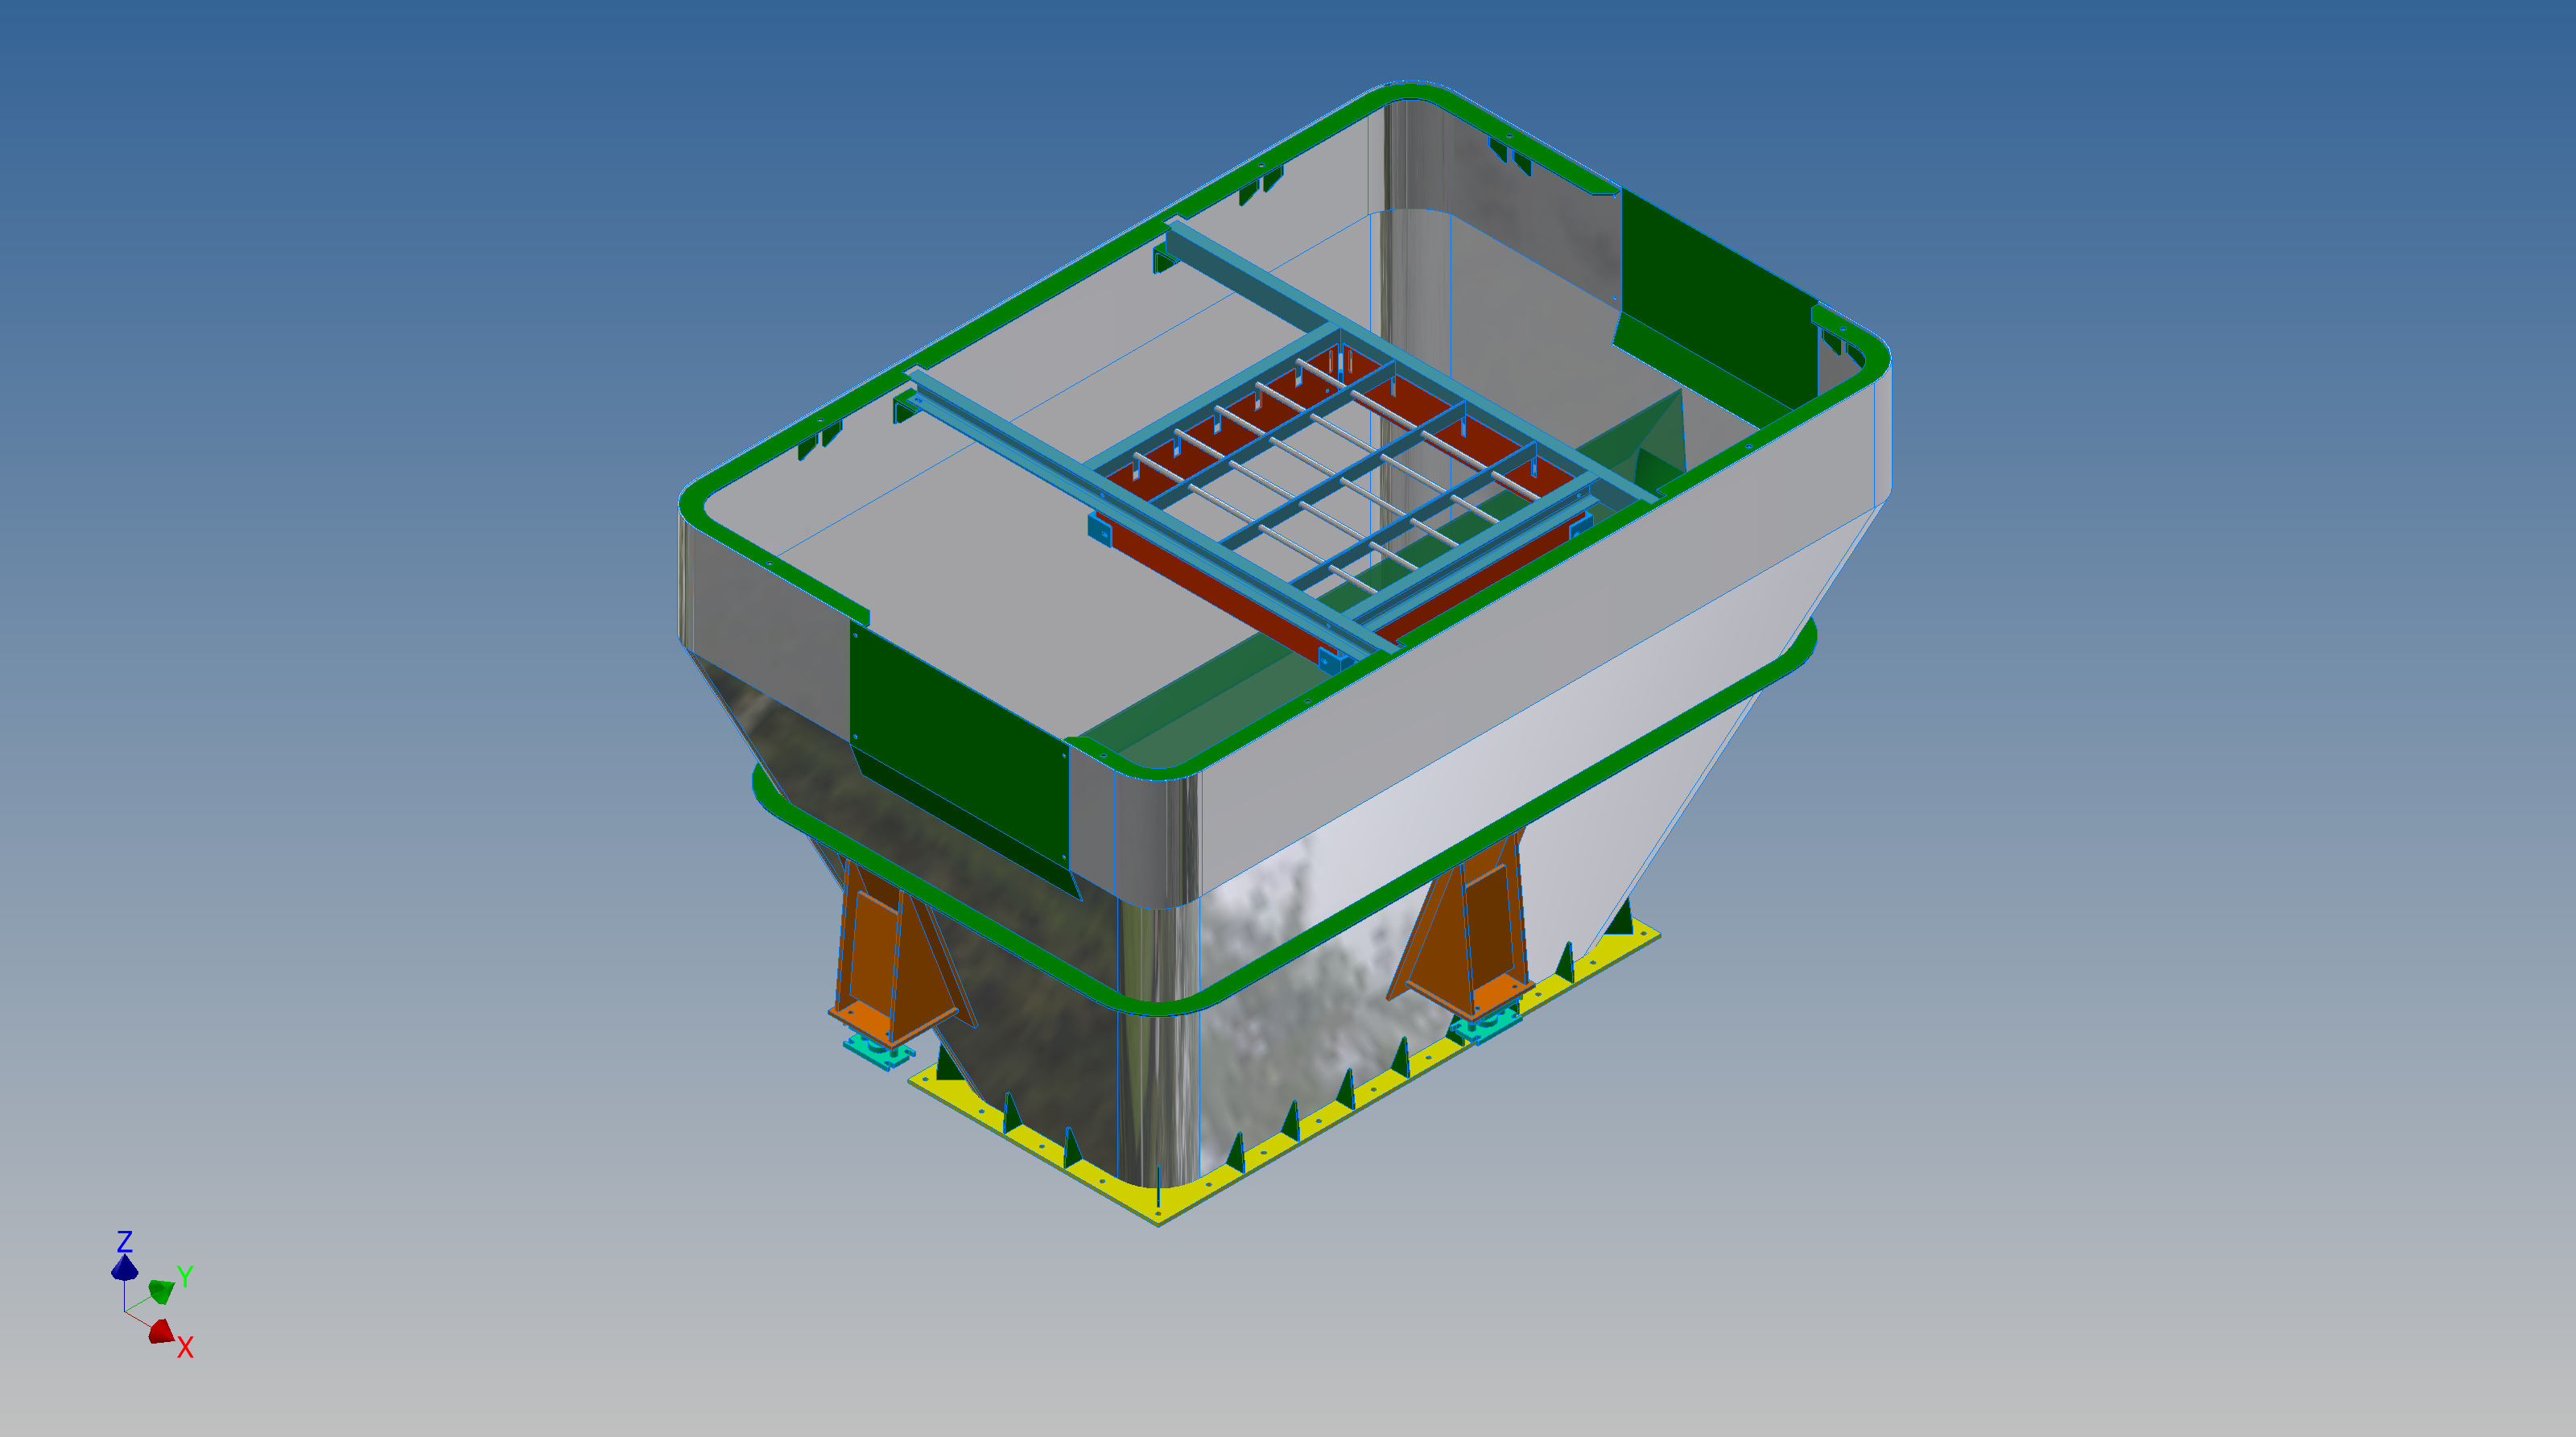
The type of machinery used to service Coke Ovens is extraordinarily large and heavy; that runs on rails not too dissimilar to trains. These images show examples of Transfer Cars that essentially transfer coal stored in overhead bunkers to the ovens below.

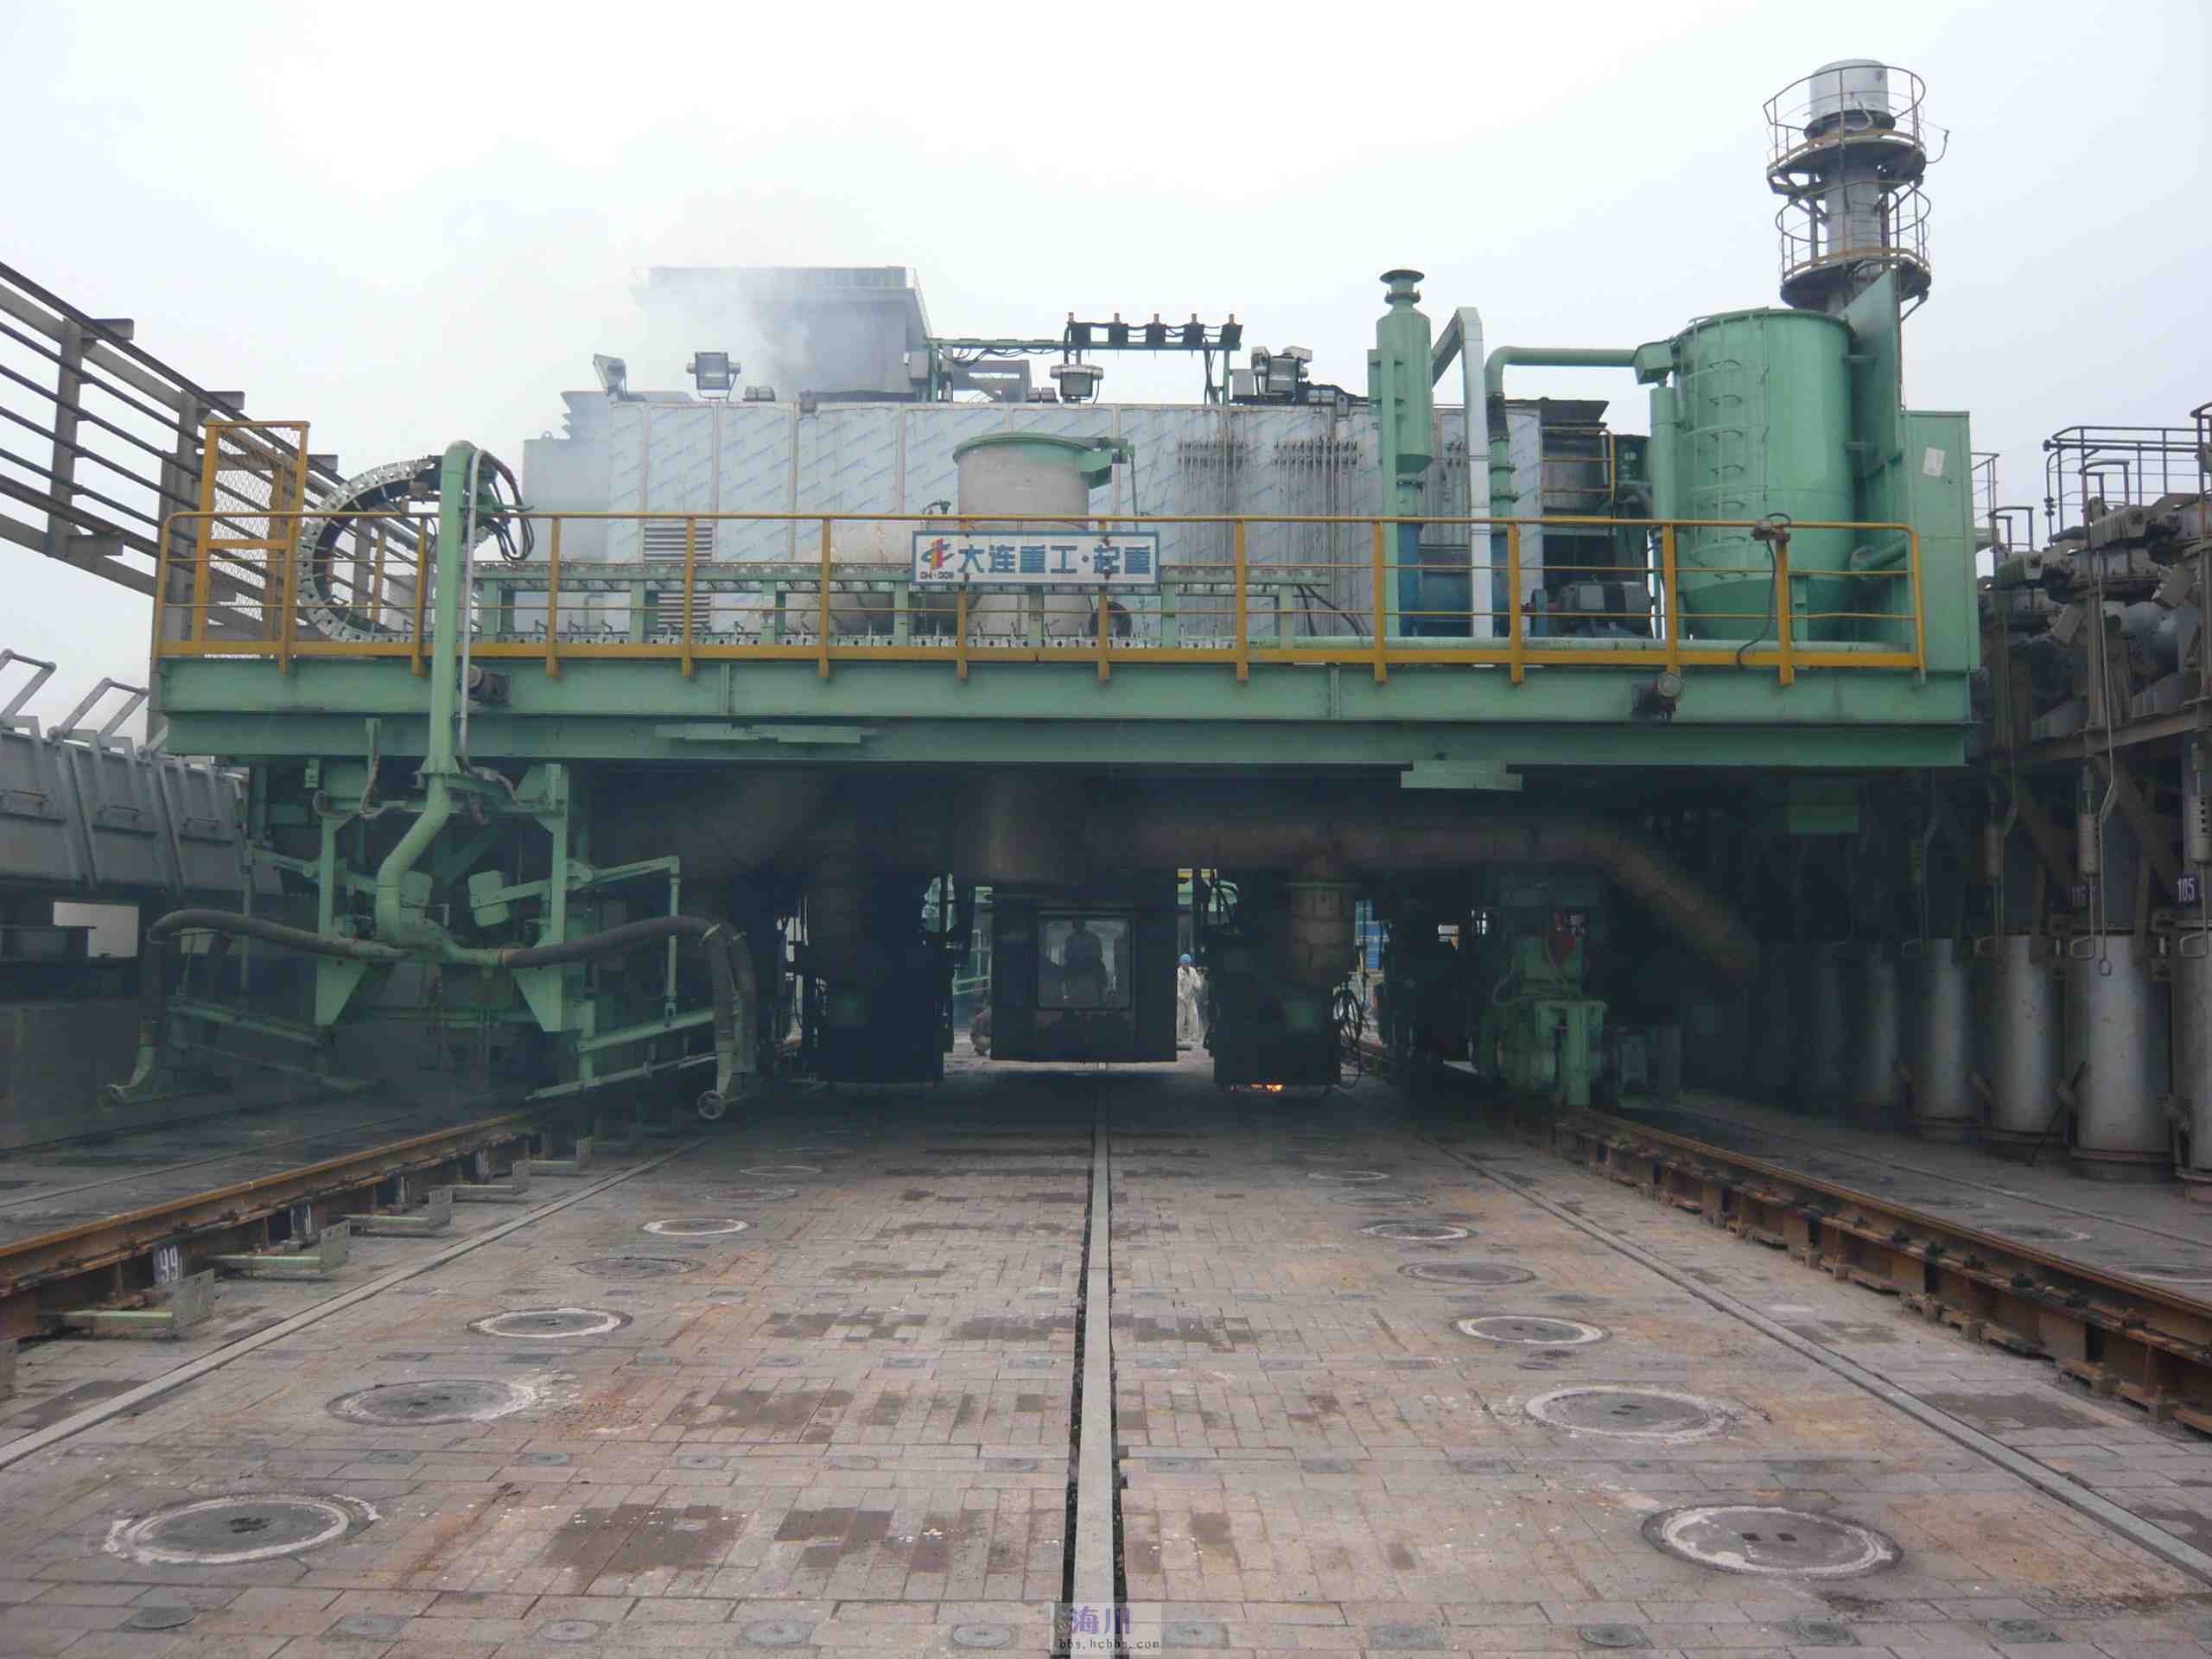
These machines work in a very corrosive environment and are often replaced with new vehicles after many years of service. A prerequisite to designing is to commission a fully detailed survey of the track rails and surrounding constructions, which provides the basic criteria and envelope parameters to define the design’s physical restrictions.

In this article what I am talking about is related to the rails on which these vehicles will run. As you can imagine after decades of use they tend to shift alignment and are never truly straight and in line. So it is important to have these correctly surveyed in order to determine the ideal location for the wheel centres on the bogeys. Before I started with this company the way this was done was simply to average out the survey information to achieve a suitable centre line on which to locate the wheels. I figured there may be a better way, so I introduced them to Linear Regression Analysis, which essentially does the same thing but more accurately.

Oddly enough the array of points shown in this Linear Regression Analysis is very similar to a survey plot of rails. It, therefore, was a logical progression to utilize this same technique to determine the Best Fit Centre Line for the Coke Oven machinery wheels.

I did this for a number of projects in each case establishing the linear regression for both tracks and in turn defining a line equation from which to extrapolate the ideal centre line. Because the 2 tracks were separate components the line equations would be slightly different with both rails not necessarily being parallel at any given point. So what happens next is to essentially repeat the process this time finding the ideal best fit line between the tracks and then checking in CAD to see how the vehicle would run.

I termed this process as Crabbing, essentially checking the determined centre of the vehicle and therefore the wheel centres along the length of the Liner regression track lines. There is obviously some adaptability built into the bogey designs to account for track variation and it is the purpose of this exercise to determine whether we could achieve movement of the vehicle within the requisite design parameters.

This is also a technique that can be used to optimise ordinate profiles where accuracy is critical. When you think about it most dimensional data points are specified to an accuracy of 1/32″ or 0.7mm which is normally within acceptable parameters however for greater accuracy why not try using linear regression analysis?

It was a useful technique and worked very well. So next time you need to determine the best fit line within a range of static survey points perhaps consider using Linear Regression to help achieve the desired results.

P-51D Mustang: Conic Formula in Excel

P-51D Mustang: Conic Formula in Excel

A quick technote on entering a conic formula in MS Excel spreadsheets. Getting the correct syntax is critical to achieving correct results.

I am updating the ordinate datasheets for the P-51 B/C and D models to incorporate new information using the various conic formula according to the curve type. Typically with these equations, there are a number of constants to be established to input to the final quadratic formula.

excel formula 2

test equation
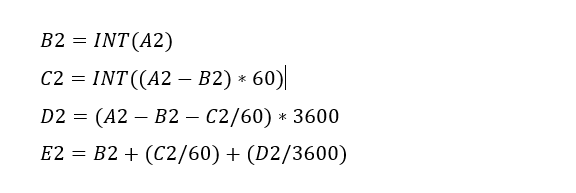
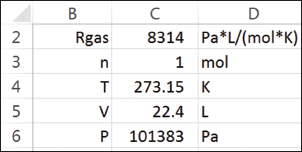
The original formula for one of the constants “P” is given as shown (1). If we enter the formula as prescribed in a hand calculator it will evaluate correctly but will not work correctly in Excel in this format. So we need to tell Excel to essentially divide everything in the top line by everything in the bottom by adding parenthesis as shown (2).

The bottom line shows the actual input in the excel formula bar (3).

We are continually working on updates to the Ordinate and Cad package so watch this space for new articles. There will also be in-depth tutorials on interrogating ordinate information to find max-width, tangents and matched second-degree curves as well as updates on detail drawings.

NAA P-51D Mustang: Landing Gear Dims

NAA P-51D Mustang: Landing Gear Dims

I am currently working on the Landing Gear geometry dimensions to check the data for accuracy. During the course of this research, I thought it may be of interest to share some Excel formula for converting angles shown in Deg Min Sec to decimal degrees and vice versa.

p-51 Landing Gear

The plan angle for the OLEO Strut relative to 25% wing chord is 4° 32′ 35.14″ as shown in the above sketch which translates to 4.543094 degrees.

The accuracy of the angles and dimensions in the NAA documentation is rather good with small deviations occurring of only 0.003mm when developing this in CAD. I should note this deviation is negligible and for all intents and purposes can be ignored. However, I like to get this stuff right so I have set about developing the landing gear dimensions to be as close as possible to be exact.

As I have already developed the cad geometry I measured the same angle above from the CAD system which is now giving me 4.54309673 degrees.

In Excel:

excel table

Starting from the left; in column A; I have input the angle from the cad system, then systematically converted to Deg, Min, Sec in separate cells and then converted back to a decimal angle in column E.

The equations for each cell are as shown below:

p51 Landing gear eq

Just enter the equation in the cells denoted; so for the first equation, this would be in cell B2. The latter equation works fine without parenthesis, which I included just to keep the equation tidy.

The Landing gear geometry will be recorded in a separate spreadsheet and added to the P-51 Ordinate Package. Mustang P-51 Ordinates

P-51D LG

Vought F4U Corsair: Ordinate Data

Vought F4U Corsair: Ordinate Data;

About 6 months ago I received an ordinate dataset from a good friend Gary Henry for information purposes. It is a very comprehensive set for the fuselage comprising over 2800 points to define in excess of 1930 individual ordinates.

Vought_F4U_Corsair_(USMC)

I have recently updated my data processing procedure utilizing new features in MS Excel particularly the “TEXTJOIN” command which makes it a lot easier to extrapolate the X,Y,Z ordinates from large datasets. This dataset was ideal to work with the new process.

F4U Corsair Ordinates

The Textjoin function allows you to predefine a delimiter and then select either an array of data or individual cells using the Control/Mouse combination. You can see I have locked in the selected column and the top row. The units shown are inches but can easily be converted to millimeters.

F4U Corsair RevB

Due to the nature of the dataset, there is a very distinct central plane on the zero vertical plane, which of course I would filter out if I decided to progress this further as a CAD model. I don’t have enough of the manufacturers’ original drawings to develop this aircraft at this time but it sure is interesting working with other datasets.

F4u-1 sideview

The dataset is actually very good only 3 points not quite in alignment. I profiled the top and bottom contours and the contours either side of the fuselage centerline; all 4 curvatures were very smooth.

Update Oct 2018:

Recently received some new data that has allowed me to progress this project with the development of the Cabin ordinates as shown below.

F4U Cabin

F4U Corsair2

Excel Spreadsheet Technote:

1. Use names in lieu of cell addresses

Consider the ideal gas law (Wikipedia) calculation in the Excel spreadsheet in Figure 1.

fig_01

Figure 1. For easy readability, this ideal gas law calculation has labels in the left column, values in the center column, and units in the right column.

Contrast the following formulas for calculating the value in cell C6:

ufig_01

Although this is a simple example, the advantage of the formula on the right is evident. In order to reverse-­engineer formulas that use cell addresses, such as the one on the left, you would have to trace back the source of each quantity. The formula on the right uses cell names that relate to the variable names from the familiar algebraic ideal gas equation. The style of the spreadsheet layout also improves read­ability. In Figure 1, the labels in column B are the same as the names for the cells in column C.

There are three common ways to create names for cells. A convenient method is to select the cell, and type the name into the Name Box field above the column A label:

ufig_02

You can also transfer the label from an adjacent cell onto the cell of interest using Create from Selection in the Defined Names group on the Formula tab of the Ribbon (Figure 2). In fact, more than one label can be transferred with a single command.

fig_02

Figure 2. Create names for cells using the Create from Selection command.

 Use the Name Manager in the same Defined Names group to create, edit, and delete names. Cell names generally have global scope in the workbook, but it is possible, using the Name Manager, to create names that have scope only in the worksheet where they are created.

Note that certain names are not allowed. First, you cannot create a name that is the same as a cell address. Given the size of the modern worksheet (the Excel spreadsheet has 214= 16,384 columns and 220 = 1,048,576 rows — a total of 234 cells), with columns out to XFD, it is easy to confuse a name with a cell address. Second, you cannot use the letters R or C as names or those letters followed by any digits. This restriction harkens back to the R-C method of cell addressing (i.e., row-column), which is rarely used today.

The following shows an example of practical formulae using named cells.

2. Set up calculations in their natural sequence and targeting methods.

It has been said before many times to start at the beginning and finish at the end. For most engineering problems, there is a natural sequence that starts with basic data and proceeds step-by-step to a final result. However, in many calculations, you may need to find one or more starting values that yield a desired final result, or a target value (Figure 3). The target may be a specific value, or it could be the minimum or maximum of a function, such as cost or profitability. The calculation may have more than one input cell, and there may be constraints on various elements of the calculation.

Figure Template Standard

Figure 3. Targeting methods, such as Goal Seek or Solver, can help you determine the input value that yields a desired output or target value.

For one-time solutions of these targeting problems, you can often simply adjust the input value by trial-and-error and meet the target after only a few tries. Excel offers two tools that automate this procedure: Goal Seek and Solver. (The Solver is an add-in provided by Frontline Systems. For information and guidance on using the Solver, see www.solver.com.)

Excel’s Goal Seek is only able to solve target value problems. It is a black-box tool that does not give the user options or control over its numerical procedure. For example, we want to determine the liquid depth in a 4m-diameter spherical tank that corresponds to a volume of 10 m3. The formula is:

08-B2B_Spreadsheets_Eq_1

where V is the volume, h is the liquid depth in the tank, and Rd is the radius of the tank. We set up a calculation on the spreadsheet based on a test value of 2 m for the depth (Figure 4a-b).

fig_07

Figure 4. The total volume of a liquid in a tank is calculated for an arbitrary liquid height of 2 m (a) by the formulas shown in (b). Use Goal Seek to set the volume equal to 10 m3 by changing cell h (c) to find the depth corresponding to a 10-m3 volume (d).

Invoke Goal Seek from the What-If Analysis drop-down list in the Data Tools group of the Data tab of the Ribbon. Complete its fields, as shown in Figure 4c, by setting cell V equal to 10 m3 by changing cell h. Upon clicking the OK button and accepting the result, we have the solution that h = 1.45 m (Figure 4d).

TechNote: MS Excel Drawing Register P-51

TechNote: MS Excel Pivot Tables: Drawing Register P-51

The drawing archive collection for the Mustang P-51 includes an NAA Document register in PDF that lists all the Scan Index Numbers, Drawings Number, Aircraft Type and Change (Revision)Number.

To make sense of this large archive; containing thousands of scanned images; it is necessary to first transpose the comprehensive NAA document register into a spreadsheet in order to analyse and filter the data according to requirements.

My requirements are simply to be able to group the data per content; Fuselage, Wings, Equipment etc; and per aircraft type; P-51A, P-51B, P-51C etc.

Further breakdown of data would involve isolating the main assemblies and then parts or sub assemblies belonging to each.

2015-06-12_22-06-44From Adobe Acrobat I extracted the pages of data as spreadsheet tables to which I added a Drawing Description and grouped the data sets together by “Content”…that took a long time to do as the extracted data first had to be checked and then sorted accordingly.

The drawing descriptions came from an index already created by Norman Meyers at Chanute Air Museum, so it was relatively easy to enter this data into my spreadsheet. Its a real pity I had not had access to Normans data earlier; could have saved me a lot of work.  My thanks to Norman Meyers.

2015-06-12_23-39-41After sorting the data and inserting descriptions I now have separate worksheets for the content similar to this one.

What I really want now is to identify and organize the drawings belonging to each type of aircraft. For this exercise I use the Pivot Table function in Excel. Pivot Tables are great for organizing and summarizing data according to specific criteria.

2015-06-12_22-34-13Here I have initiated the Pivot Table function and selected the entire data-set of information relating to the Fuselage; as you can see we have a large number of drawings just for this one area!

When working with large data-sets it is good practice to select a new worksheet for inserting this new table.

2015-06-12_22-38-07What we end up with is a new worksheet with the pivot table outline on the left and a selection box on the right. We now select from the latter the columns of data we want…in this case all the main ones plus the P-51D; which will populate the outline table on the left.

Pivot tables by default include a summary row under each entry; I suspect this is more useful for statistics than organizing a document register; which we don’t want.

2015-06-12_22-49-34To remove the summary from the table we just need to select each column in turn using the small arrow as highlighted and turning off this option in “Field Settings” and select “None”.

The final step is to filter the data according to the required criteria; in this case I want all the drawings that have an “X” value in the P-51D column.

2015-06-12_22-54-42This is done by selecting this value from the header drop-down options; which lists by default the unique values in each column from the master table.

We now have a list of all the fuselage drawings and their location in the archive belonging to the P-51D aircraft.

The next step would be to extrapolate all the “assembly” drawings and from there the components that make up each assembly…but that’s for another day.

Pivot Tables are great for this type of job.

  • 846 fuselage drawings for the P-51A
  • 890 fuselage drawings for the P-51B
  • 833 fuselage drawings for the P-51C
  • 923 fuselage drawings for the P-51D
  • 950 fuselage drawings for the P-51H

Many drawings of course are a shared resource for all variants. This drawing register has recently been updated with hyperlinks to all the drawings listed. See this post for details.

For further information on any of these projects please feel free to drop me a line via my contact page or email me at hughtechnotes@gmail.com